The naive strategy of buying banks based on price/book ratio: An evaluation based on 2024 results
A wise financier whose name escapes me once wrote that the trouble with banks is that they have assets that are impossible to value, and the trouble with insurance companies is that they have assets and liabilities that are impossible to value. Given the current situation with insurance companies and natural disasters, this is a difficult statement to gainsay, and likewise valuing mortgages and derivatives is difficult even during non-financial crisis times.
However, the possibility did occur to me that even if valuation of such companies is error prone, the error might in fact be nonbiased, which is to say that one has the same odds of guessing too high as too low. And so, as most valuation techniques of banks and insurance companies center on the balance sheet, could the naive strategy of assembling a portfolio based solely on buying companies with a low price/book ratio and avoiding the companies with a high price to book ratio be a valid strategy?
In order to investigate this, I computed the price/book ratio of all the banks in the Value Line investment survey (which hopefully is a representative sample) as of roughly February 2, 2024 and examined their one year performance. I decided to focus on the smaller community or regional banks, ignoring the massive money center or investment banks. And then, because banks are complicated by goodwill and other intangible assets, I did the same with tangible book value, which most but not all banks are kind enough to report in their earnings announcements. I then ran a linear regression analysis, as data mining analysts are known to do.
Before I reveal the results, I should try to discuss why banks and insurance companies are more transparent to balance sheet analysis than other companies. The reason is the assets of, say, an industrial company, are custom-designed to produce a particular product, and the value of those assets on the balance sheet may have nothing to do with their actual value in the economic sense, which is determined mainly by the demand for the company’s product and its competitive position. However, banks’ assets are generally marketable and fungible, as a bank’s “product” is simply the use of money, and the size of its portfolio of assets is generally a reasonable measure of its ability to do so. Insurance companies operate in an analogous way; they profit by taking in premiums and investing them, thus pocketing any investment income produced between when the premium is collected and when claims are paid.
So, how did my regression turn out? I have to confess, not at all convincingly. Using pure book ratio, the r squared turned out to be less than 1%, and eliminating outliers it actually went down. Tangible price to book ratio, outliers or not, fared no better. The r squared, recall, measures how much of the variation in the dependent variable (investment returns) is determined by the independent variable (price/book ratio). A value of 1% implies that hardly any relationship between the two exists.
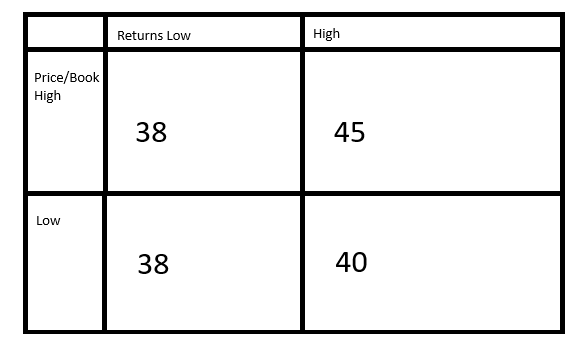
However, the r squared is not the end-all of analysis, and much like the Spanish Inquisition, when you have data you want to torture it until it says something. So, I divided my 161 banks into four quadrants based on whether the price to book ratio was below the mean or above and whether the one year return was below the mean or above. Using the raw price to book ratio, 38 banks had a low price/book ratio and below average returns, 40 banks had a low price/book ratio and above average returns, 38 banks had a high price/book ratio and below average returns, and 45 banks had a high price/book ratio and above average returns, which more or less confirms what the regression told us, that at least in 2024 price/book ratio had essentially nothing to do with performance, and indeed the number of banks that broke the rule outnumbered the ones that followed it.
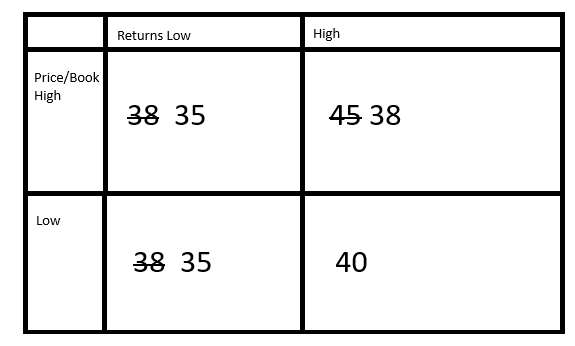
However, I did mention outliers before; there are times when the reported price/book ratio is so unrealistic as to be “obviously” wrong. I decided that any bank with a price/book ratio below 0.5 or above 1.8 was so far beyond the pale that it was unlikely that investors were seriously using it as a criterion. This eliminated three of the low price/book, low return banks, three of the high price/book, low return banks, fully 7 of the high price/book, high return banks, and none at all of the low price/book, high return banks. Curiously this has the salutary effect of making the proposed strategy look slightly better, but at the cost of eliminating a disproportionate number of high return banks, which obviously is exactly the opposite of what we want.
Applying the same method to the tangible book value, we find as follows:
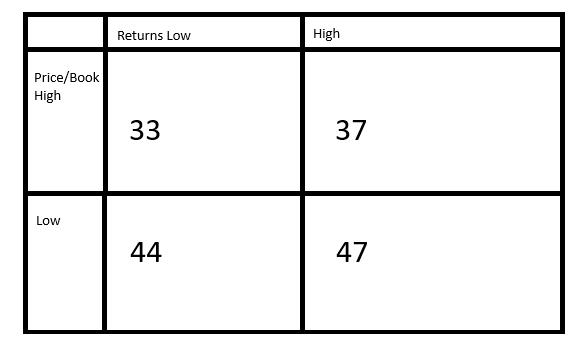
Notice that there are more below average tangible price/book ratios. This is not surprising as a bank’s tangible assets can always be less than its raw book value but can never be greater. However, we still see that whether the price to book ratio is low or high, the odds of outperforming the average is the same as underperforming.
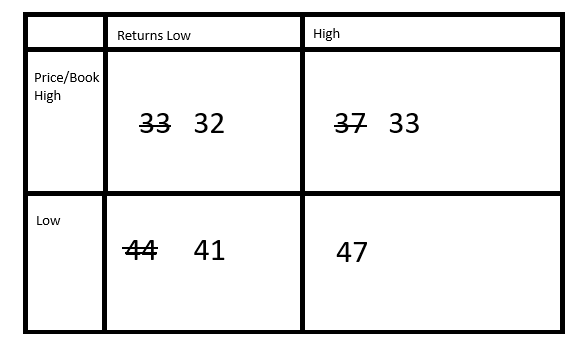
But, applying our search for outliers again we see that low price/tangible book value stocks are made to look slightly better.
Perhaps 2024 was an unusual year for banks, but it may be that investors who assign a high price to book ratio are actually seeing something in those banks that, if the year bears out their expectations, will justify a price advance and presumably an even higher multiple. Or it may be that a naive and cheap to execute strategy like low price to book is naturally too simple and exploitable to reliably produce outperformance. I may have to repeat this experiment with insurance companies or other years of historical data.
Leave a Reply